The average salary in India in 2026 is roughly ₹7 to ₹9 lakh per year (LPA), with a median closer to ₹5 to ₹6 LPA. That single number is close to useless for budgeting, though. Pay swings three to four times by industry, 20 to 40 percent by city, and 50 to 100 percent by company type for the very same role. This guide benchmarks all three, then adds the 20 to 30 percent statutory stack that turns a quoted salary into your true cost to company.
If you are planning to hire in India, the first question is almost always the same: what does it actually cost to put a good person on the team? It sounds simple. It is not. India is not one labour market, it is dozens of them stacked on top of each other, split by sector, city, company type, skill and experience. A senior software engineer in Bengaluru and a hotel front-desk supervisor in a small town are both the average Indian employee in some statistical sense, yet their pay can differ by a factor of ten.
That is why a single national figure falls apart the moment you try to budget with it. This guide breaks the picture down the way a hiring manager or finance lead actually needs it: by industry first, then by role, experience and city, and finally by the statutory costs that turn a quoted salary into a true cost to company. Where numbers come from public aggregators and 2025 to 2026 consultancy guides, we say so, and we flag where the data is noisy so you treat it as a benchmark rather than gospel. Peorient is an independent advisory platform for global hiring, so the lens throughout is the employer’s. If you are weighing India against other markets, our companion guides on building a workforce in India without a local entity and the best Employer of Record providers in India pick up where salary benchmarking leaves off.
What “average salary” really means in India
Before any table is useful, three distinctions need to be clear. Skip them and you will either overpay out of caution or quote an offer so low that no serious candidate replies.
Mean versus median
The mean is the simple average: add every salary and divide by the number of earners. The median is the middle value, the point where half of earners are above and half below. In a market with a small number of very high earners, the mean drifts well above the median. India is exactly that kind of market. A few lakh extremely well paid technology, finance, and leadership professionals lift the national mean to roughly ₹7 to 9 LPA, while the median for salaried professionals is closer to ₹5 to 6 LPA, and the median across the broader formal workforce is lower still.
Official data makes the point bluntly. The Periodic Labour Force Survey reported average monthly earnings for regular wage and salaried workers of roughly ₹24,000 for men and ₹18,000 for women, which annualises to between ₹2 and ₹3 LPA. That is the reality for the majority of India’s formal workforce, even though salary headlines almost always quote the higher mean. When you read “the average salary in India is ₷9 lakh,” read it as “the average for the kind of professional roles that get written about,” not the typical worker.
CTC versus take-home
Indian salaries are almost always quoted as cost to company (CTC), the employer’s total annual outlay for one person. CTC bundles base pay, allowances, employer provident fund, gratuity provisioning, bonus, and sometimes insurance and other perks. The employee’s in-hand or take-home pay is considerably lower after provident fund, professional tax, and income tax withholding. A ₹12 LPA CTC commonly lands as something in the region of ₹75,000 to ₹85,000 per month in hand, depending on the salary structure and tax regime. Candidates negotiate on CTC, but they care about take-home, so a well-designed structure matters.
Organized versus unorganized sector
Roughly four in five Indian workers are in the unorganized or informal sector, where pay is irregular and statutory benefits are thin. Salary surveys, including this guide, describe the organized sector: registered companies with formal payroll, provident fund, and compliance. When you hire through your own entity or through an Employer of Record, you are by definition operating in the organized sector, so organized-sector benchmarks are the ones you should plan against.
The national salary picture in 2026
With those caveats in place, here is the broad shape of the market in 2026. The all-industry average annual salary is widely estimated at ₹7 to 9 LPA, which works out to roughly ₹55,000 to ₹75,000 per month before deductions, against a median nearer ₹5 to 6 LPA. Entry-level professional roles commonly start between ₹4 and ₹5 LPA, mid-level technical roles cluster around ₹12 to ₹18 LPA, and senior specialists and managers run well beyond ₹25 LPA.
Two structural facts sit underneath every number that follows. First, India produces an enormous supply of graduates each year, including more than a million engineering graduates, which keeps entry-level pay competitive and creates a deep, English-capable talent pool. Second, demand is highly concentrated in a handful of high-skill areas, which is why the spread between an in-demand specialist and a generalist at the same experience level keeps widening. The headline average is the midpoint of a very wide distribution, not a typical paycheck.
Average salary in India by industry (2026)
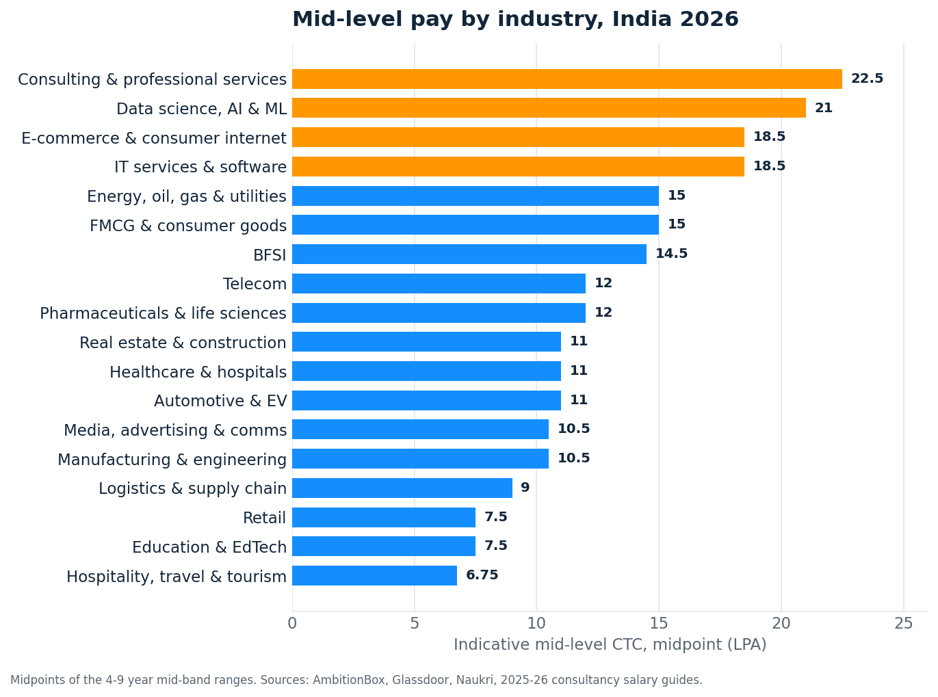
This is the heart of the guide. The table below gives indicative annual CTC ranges by industry across three experience bands. Figures are synthesised from public salary aggregators such as AmbitionBox, Glassdoor, and Naukri, and cross-checked against 2025 to 2026 consultancy salary guides from firms like Michael Page, Aon, and the EY Future of Pay report. Treat them as planning benchmarks. Your actual offer will move with company type, specific skills, and how hot the role is in a given quarter.
How to read these numbers
The bands are wide on purpose. Within IT services and software, a fresher at a large service company and a fresher at a product startup sit at opposite ends of the entry band. The mid band is where most active hiring happens and where benchmarking matters most. The senior band is where total compensation, including bonus and equity, varies so much that a single range can only point you in a direction. Use the table to find the right neighbourhood, then narrow down by company type and city using the sections below.
IT services, software and SaaS
Information technology remains India’s highest-paying broad sector and the single biggest reason global companies hire here. The internal split is the thing to understand. Service companies pay solid but moderate salaries, with freshers often in the ₹4 to 6 LPA range and five-year engineers around ₹12 to 20 LPA. Product companies and well-funded startups pay a clear premium, frequently 50 to 100 percent more for the same experience, with strong mid-level engineers landing ₹18 to 35 LPA and senior architects pushing ₹50 LPA and beyond. For a foreign employer, a capable mid-level engineer in a tier-one city typically costs ₹12 to 18 LPA in CTC, roughly 14,000 to 22,000 US dollars a year, against a hundred thousand dollars or more for the equivalent role in the United States. If you are building a remote engineering team, our guide on building a workforce in India without a local entity walks through the mechanics.
Data science, AI and machine learning
This is the hottest band in the market and the one moving fastest. A generalist data scientist averages around ₹11 to 15 LPA across experience levels, from ₹6 to 9 LPA for freshers to ₹25 LPA and beyond for seniors. The defining 2026 story is the generative AI premium: specialists in GenAI, large language model engineering, MLOps and computer vision command roughly 25 to 40 percent more than generalists at the same level. At Global Capability Centres and product companies, senior AI engineers frequently clear ₹30 to 60 LPA. If your hiring depends on scarce AI talent, budget for the premium and move quickly, because these candidates field multiple offers.
BFSI: banking, financial services and insurance
BFSI is one of India’s largest organized employers and a consistent top-tier payer, especially as roles climb into specialised finance, risk and technology functions. Entry-level roles often sit between ₹3.5 and 7 LPA, mid-level professionals between ₹9 and 20 LPA, and senior specialists well past ₹25 LPA, with investment banking, quant and fintech roles at the high end. Variable pay is a larger share of total compensation here than in most sectors, and clawback provisions on bonuses are increasingly common, so model total compensation rather than base alone.
Global Capability Centres (GCCs)
GCCs, the in-house offshore centres that multinationals run in India for technology, finance, analytics and operations, deserve their own mention because they are reshaping the top of the market. They consistently pay above local service-company rates, are projected to lead salary growth in 2026, and increasingly hold senior, strategic roles rather than only back-office work. If you are a larger employer choosing between a captive centre and a partner-led model, the salary premium GCCs pay is real, but so is the overhead of running one. For most teams under a few dozen people, a partner model reaches the same talent without the fixed cost. Our overview of international PEO services compares the options.
Consulting and professional services
Management consulting, advisory, audit and legal services pay strong entry salaries and steep progression. Freshers from top institutions can start at ₹6 to 12 LPA, mid-level consultants reach ₹15 to 30 LPA, and partners run well into the high tens of lakhs and beyond. The premium reflects credential intensity and client-facing pressure. For employers, consulting talent is expensive but mobile, so retention design matters as much as the offer.
Pharmaceuticals, healthcare and life sciences
Pharma sits comfortably in the upper-middle band and has been a steady riser. Research, regulatory, clinical and quality roles pay well, with mid-level professionals commonly between ₹8 and 16 LPA and senior scientists reaching ₹20 to 45 LPA. Hospital and clinical-services pay is more variable: administrative and allied-health roles sit lower, while specialist clinicians average well over ₹14 LPA. India’s large contract research and manufacturing base keeps demand firm.
Manufacturing, engineering and automotive
Core manufacturing and engineering pay below technology and finance in absolute terms, with mid-level roles typically ₹7 to 14 LPA, but they are seeing some of the strongest increments in 2026 as India’s production and export ambitions expand. Automotive, including the fast-growing EV segment, follows a similar pattern with a premium for design, electronics and battery skills. The takeaway for industrial employers: India is no longer only a low-cost assembly story, and its engineering design and R and D talent is genuinely competitive.
E-commerce, consumer internet, FMCG and retail
Consumer-facing sectors split sharply by function. In e-commerce, technology and product roles track the high IT and AI bands, while operations and field roles sit much lower. FMCG is famous for brand-name graduate programs and management-track pay, with mid-level managers commonly ₹10 to 20 LPA. Traditional retail sits at the lower end for frontline and store roles, though corporate and category-management positions pay competitively. Sales roles across all of these carry heavy variable pay, so a ₹12 LPA average can swing widely with performance.
Telecom, energy, infrastructure and other sectors
Telecom, energy, oil and gas and utilities are stable, mid-to-upper-band payers, especially for engineering and specialist technical roles, with senior positions reaching ₹25 to 55 LPA. Real estate and construction pay solid mid-band salaries with strong variable components in sales-led roles. Media, advertising and communications pay moderately, with senior editorial and brand roles reaching ₹15 to 30 LPA. Education, hospitality, travel and logistics generally sit at the lower end of the professional spectrum, though specialist and leadership roles within them still pay well. The pattern across all of these: the sector sets the floor and ceiling, but the specific role and skill set decide where inside the band you land.
Average salary in India by job role
Industry sets the band, but most hiring decisions come down to a specific role. The table below benchmarks common roles across all sectors at mid-level (roughly 4 to 8 years), where the bulk of active hiring sits. Figures are indicative annual CTC and move with city, company type and skill depth.
A role-level view matters because the same job pays very differently depending on whether it is core or support to the business. A data scientist at a SaaS company, where the role drives product and revenue, sits at the top of the band, while the same title in a support function of a non-tech firm sits lower. When you benchmark, ask not only what the role pays, but how central it is to the company you are competing with for the candidate.
Salary by experience level
Experience is the second-strongest determinant of pay after sector, and the curve in India is steep early then flattening later. The jump from entry to mid-level often doubles pay within four to six years for in-demand roles, while progression from senior to leadership depends more on scope and company than on tenure alone.
One behaviour shapes the whole curve: in India, switching employers usually delivers a far bigger raise than staying put. External moves commonly bring 30 to 50 percent jumps, against internal annual hikes of 8 to 12 percent. For employers, that means retention is won through total package and growth, not loyalty, and the market rate for an experienced hire is often set by what a competitor would offer to poach them, not by what your existing team earns. For a related view on where statutory floors sit versus market pay, see our guide on the difference between minimum wage and average salary in India.
Salary by city and region
Location is the third big lever. Tier-one metros pay 20 to 40 percent more than tier-two and tier-three cities for comparable roles, driven by cost of living and the concentration of high-paying employers. The flip side is that tier-two cities offer real savings and a growing, capable talent pool, which is why many employers now hire there deliberately.
How India pay compares globally
For most foreign employers, the reason India is on the shortlist at all is the combination of deep talent and a large cost advantage. The advantage is real and broad. Across professional roles, India talent typically costs 40 to 60 percent less than an equivalent hire in the United States or Western Europe, and for some senior technology roles the gap is wider still.
The clearest example is software engineering. A capable mid-level engineer who costs roughly ₹12 to 18 LPA in India, around 14,000 to 22,000 US dollars a year fully loaded, would command 100,000 to 150,000 dollars or more for an equivalent role in a major US market. Even after a partner or payroll fee, the total landed cost stays dramatically lower, and the same pattern holds across finance, analytics, design, customer success and operations. Two cautions keep this honest. The gap narrows fastest at the very top, where scarce AI and product talent now fields globally competitive offers, so do not assume India is uniformly cheap for elite specialists. And low headline cost is not the same as low total cost if you get compliance wrong: misclassification, missed contributions and permanent-establishment risk can erase the saving quickly. The advantage is best captured by hiring compliantly through an Employer of Record, which is why so many companies pair the India opportunity with a partner rather than a rushed entity setup. Our guide to international PEO services sets out how the comparison plays out across markets, and our minimum wage by country guide helps sanity-check statutory floors elsewhere.
What drives salary differences in India
Pull the threads together and seven factors explain almost all of the variation you will see in any benchmark:
- Industry. The single biggest factor. Technology, finance, and consulting set the ceiling; hospitality, retail, and education set the floor.
- Role and skill scarcity. In-demand skills (AI, cloud, cybersecurity, data) carry premiums of 30 to 40 percent over generalist roles, regardless of sector.
- Experience. Steep early progression, with the entry-to-mid jump often doubling pay.
- City. A 20 to 40 percent metro premium, and a 30 to 50 percent saving in tier-two locations.
- Company type. Product companies, GCCs, and funded startups pay 50 to 100 percent more than service firms for the same role.
- Education and pedigree. Graduates of top engineering and management institutions command a measurable starting premium that narrows over time as skills take over.
- Variable and equity. Sales, BFSI, and senior roles carry large performance-linked components; startups add equity that does not show up in a base-pay benchmark.
Notice what is not on the list: a single “national average.” It is the output of these factors, not an input you can plan against. The right method is to fix the role, then layer sector, city, company type, and skill on top.
2026 salary increments and skill premiums
India continues to run some of the highest salary increments among major economies. According to the EY Future of Pay 2026 report, India Inc is projecting an average salary increase of around 9.1 percent in 2026. The increase is not spread evenly. Global Capability Centres are projected to lead, followed by financial services and e-commerce, while skill premiums for AI, machine learning, cybersecurity, and cloud capabilities are rising 30 to 40 percent. Variable pay as a share of fixed pay has also climbed, and the gap between top and average performers is widening as pay becomes more sharply linked to outcomes.
The headline that surprises people: IT services, which pays the highest absolute salaries, is projecting one of the lower increment percentages, while manufacturing and automotive lead. High base, slower growth in one sector; lower base, faster growth in another. For employers, the practical implication is that a salary band that was competitive 18 months ago is probably 15 to 20 percent behind the market today. Benchmarks need refreshing annually, not every few years.
From gross salary to total cost: the CTC stack
Here is where many first-time employers in India undershoot their budget. The salary you agree with a candidate is not your total cost. Indian law requires several employer contributions and statutory payments that stack on top of base pay. As a rule of thumb, plan for 20 to 30 percent above base to reach true cost to company. The exact figure depends on salary level and structure.
Five budgeting mistakes employers make in India
Most mispriced India offers come from the same handful of errors. Watch for these before you sign off a band:
- Budgeting on the national average. The ₹7 to 9 LPA figure blends a hotel clerk and a GCC architect. Start from the sector-and-role band instead.
- Confusing CTC with take-home. Candidates compare offers on in-hand pay. Quote CTC but design the structure so take-home is competitive.
- Forgetting the statutory stack. Provident fund, gratuity and bonus add 20 to 30 percent. Leaving them out understates cost and surprises finance later.
- Ignoring the company-type premium. If you are competing with product companies or GCCs for the same candidate, service-firm benchmarks will lose you the hire.
- Benchmarking once. With 9 percent increments, a band drifts out of market within a year. Re-benchmark annually or you will quietly fall behind.
How to benchmark and set competitive pay
A repeatable method beats a single number every time. When you set a band for an India hire, work through these steps in order:
- Fix the role precisely. Title, seniority and the three or four skills that actually matter. Software engineer is too broad; mid-level backend engineer, Python and cloud, five years is benchmarkable.
- Pull a sector-and-role range. Use the master table above as a starting band, then sanity-check it on a live aggregator for the specific role.
- Adjust for city. Add the metro premium or subtract the tier-two saving based on where the person will be based.
- Adjust for company type and scarcity. Add the product-company or GCC premium if you compete for the same talent, and add the skill premium for hot specialisations.
- Translate to CTC, then take-home. Design a structure that gives the candidate competitive in-hand pay, since that is what they compare offers on.
- Add the statutory stack. Layer 20 to 30 percent on top of base to reach your true cost, then confirm against payroll.
- Refresh annually. With 9 percent increments, a band drifts out of market quickly. Re-benchmark every year.
If you are hiring across several countries, the same discipline applies everywhere, but the statutory layer changes dramatically by market. Our guides on minimum wage by country and which countries require 13th-month pay are useful for sanity-checking cross-border budgets before you commit.
How an Employer of Record helps you get India pay right
Knowing the right salary is half the job. Paying it compliantly, without a local entity, is the other half. This is where an Employer of Record (EOR) earns its fee. An EOR becomes the legal employer of your India hires through its own registered entity, while you keep full day-to-day control of their work. It runs payroll in rupees, withholds and deposits taxes, makes the EPF, ESI, gratuity and bonus contributions correctly, and keeps you compliant with central and state labour law, all without you setting up a subsidiary.
For salary specifically, a good EOR does three things that matter. It tells you the true, all-in cost of an offer before you make it, so there are no statutory surprises. It structures the salary so your candidate gets competitive take-home pay. And it absorbs the compliance risk of getting contributions and filings right in a system where rules vary by state and change periodically.
If you are comparing models, a PEO co-employs and generally needs you to have your own entity, while an EOR does not, which is why the EOR route dominates for companies hiring in India without a local presence. For a structured walkthrough, see our guide on building a workforce in India without a local entity, our roundup of the best EOR providers in India, and our list of top international PEO providers in India. If you are still deciding whether you need a partner at all, the signs your business needs a PEO or EOR guide is a quick gut-check.
Methodology and sources
The ranges in this guide are planning benchmarks, not precise quotes. They are synthesised from public salary aggregators (AmbitionBox, Glassdoor, Naukri), 2025 to 2026 consultancy salary guides (including Michael Page and Aon), and the EY Future of Pay 2026 report for increment and skill-premium signals. National earnings context draws on the Periodic Labour Force Survey. Statutory rates and thresholds are cross-checked against the India Briefing payroll resources and the Remote India payroll tax guide. Where sources disagree, we present a range rather than a false-precision point estimate, and we refresh these figures at least annually. This page was last reviewed on 29 July 2026.
Frequently asked questions
Conclusion
There is no single average salary in India, and treating the headline number as a budget is the fastest way to misprice a hire. The honest answer is a method, not a figure: start with the industry, narrow by role and skill, adjust for experience, city and company type, then add the statutory stack to reach true cost. Do that, refresh it annually, and you will set offers that are competitive without overpaying. India’s combination of deep talent and strong cost advantage is genuine, and it holds across far more sectors than the technology story alone. If you would like a second set of eyes on a specific role before you make an offer, Peorient’s advisory team is independent, free to talk to and happy to help.