Hiring in India? Get 10% off Remunance EOR fees for a full year through Peorient.10% off Remunance EOR fees for a year
Claim the offerFree for companies. Reply within 1 business day. Or email hello@peorient.com
Salaried employees in India earned an average of ₹24,217 a month (men) and ₹18,353 (women) in 2025, about $258 and $195, according to the government’s latest labour force survey. Pay varies widely by sector, city and skill, so this guide gives the official averages, what skilled roles actually pay, and how India compares with global income levels.
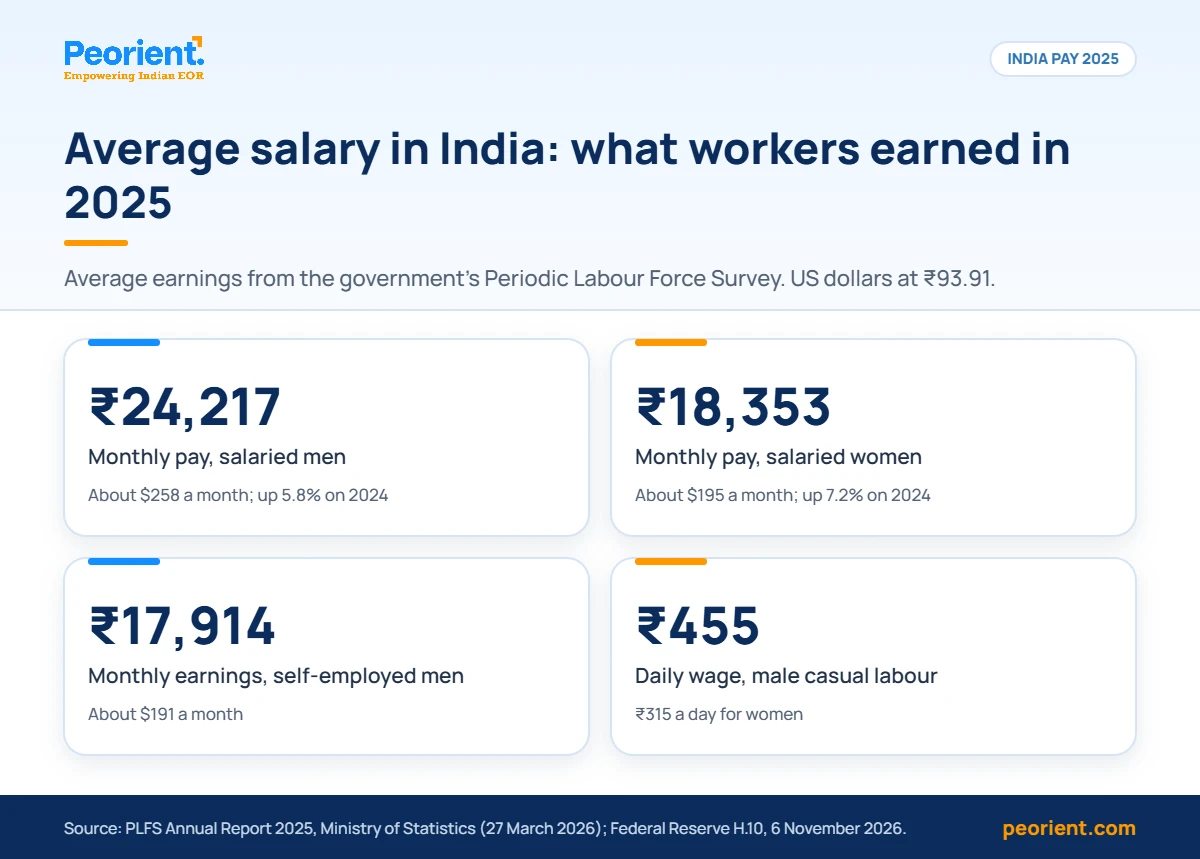
Men in regular salaried jobs in India earned an average of ₹24,217 a month in 2025 and women ₹18,353 a month, according to the Periodic Labour Force Survey (PLFS) Annual Report 2025 from the Ministry of Statistics. That is about $258 and $195 a month, or ₹2.91 lakh ($3,095) and ₹2.20 lakh ($2,345) a year, at ₹93.91 to the US dollar (Federal Reserve, 6 November 2026).
Most Indian workers are not salaried. Self-employed men earned ₹17,914 a month on average, and casual labourers ₹455 a day (men) and ₹315 (women). Skilled roles in technology, finance and consulting pay several times the national average, so use the sector and city tables below if you are hiring.
In nominal US dollars, average pay in India is a small fraction of pay in the US, UK or Germany. Adjusted for purchasing power, the gap narrows sharply; the comparison below shows both views.
Free calculator
What will an India hire really cost you?
Salary, PF, gratuity, insurance and EOR fees in one number, in rupees and US dollars. Takes about 30 seconds.
Calculate my hire costFree, no sign-up. Ready to compare providers? Get a free shortlist

Ask three economists what the “average Indian salary” is and you’ll get three different numbers. That is not a mistake, it is a feature of how we measure income in a country as economically stratified as India. Before comparing India to the US or UK, it helps to understand which number is being used, where it comes from, and what it actually represents.
The official figures come from the government’s Periodic Labour Force Survey (PLFS) Annual Report 2025, which covers January to December 2025 and was released on 27 March 2026, alongside IMF income data:
| Metric | Monthly | Annual | What it measures |
|---|---|---|---|
| Salaried employees, men (PLFS 2025) | ₹24,217 ($258) | ₹2,90,604 ($3,095) | Average monthly earnings of men in regular wage or salaried jobs |
| Salaried employees, women (PLFS 2025) | ₹18,353 ($195) | ₹2,20,236 ($2,345) | The same measure for women |
| Self-employed, men (PLFS 2025) | ₹17,914 ($191) | ₹2,14,968 ($2,289) | Average gross monthly earnings from self-employment |
| Casual labour, men (PLFS 2025) | ₹455 a day ($4.85) | Not applicable | Average daily wage, excluding public works; ₹315 for women |
| Per-capita nominal income (IMF) | $240 | $2,878 | Total national income ÷ population |
| Per-capita income (PPP-adjusted) | $1,011 | $12,132 | Same, adjusted for what $1 actually buys |
India’s compensation landscape is defined by sectoral divergence. Technology, finance, and pharma cluster at the top; agriculture, retail, hospitality and public education cluster at the bottom. The gap between the highest- and lowest-paying sectors at entry level alone is roughly 4 to 5x.
| Sector | Entry-level (annual) | Mid-level (annual) | Senior (annual) | 2026 growth* |
|---|---|---|---|---|
| Information Technology / Software | ₹4.5 to 8 LPA | ₹12 to 25 LPA | ₹30 to 60 LPA+ | 6.8 to 9.2% |
| AI / ML / Data Science | ₹8 to 14 LPA | ₹20 to 40 LPA | ₹50 LPA to 1 Cr+ | 10 to 15% |
| Banking, Financial Services & Insurance | ₹4 to 7 LPA | ₹12 to 22 LPA | ₹30 to 80 LPA | 8 to 10% |
| Consulting / Professional Services | ₹7 to 14 LPA | ₹20 to 35 LPA | ₹50 LPA to 2 Cr | 9 to 11% |
| Real Estate & Infrastructure | ₹3.5 to 6 LPA | ₹10 to 18 LPA | ₹25 to 50 LPA | 10.9% (highest) |
| Pharmaceuticals & Healthcare | ₹3.5 to 6 LPA | ₹9 to 18 LPA | ₹25 to 45 LPA | 9.5% |
| Manufacturing & Automotive | ₹3 to 5 LPA | ₹8 to 15 LPA | ₹20 to 40 LPA | 8.5% |
| E-commerce / Consumer Internet | ₹5 to 9 LPA | ₹14 to 25 LPA | ₹35 to 70 LPA | 9% |
| Education (school & coaching) | ₹2.4 to 4.2 LPA | ₹4.8 to 9 LPA | ₹12 to 24 LPA | 7% |
| Retail, F&B, Hospitality | ₹1.8 to 3 LPA | ₹4 to 8 LPA | ₹10 to 20 LPA | 6 to 7% |
| Agriculture & allied (organized) | ₹1.8 to 2.4 LPA | ₹3 to 6 LPA | ₹8 to 15 LPA | 5 to 6% |
*2026 nominal salary increase projected by Aon India Salary Increase Survey 2025-26. LPA = Lakh per annum (₹1 lakh = ₹100,000).
One data point worth internalizing: in 2026, specialists with in-demand skills are commanding 32 to 47% premiums over generalists in the same sector (Aon, 2026). The strongest premium categories are generative AI engineers, cloud security architects, SRE/platform engineers and embedded-AI product managers. If you’re hiring into these categories, the sector averages above will materially underprice the offer you need to make.
Geography is the second-biggest salary determinant after skill category. A Tier-1 tech hub pays roughly 20 to 40% more than a Tier-2 city for an identical role, and Bengaluru leads almost every sector index in 2026.
| City | Tier | Average monthly salary | Role strength | Cost of living index* |
|---|---|---|---|---|
| Bengaluru (Bangalore) | Tier 1 | ₹45,000 to 95,000 | Tech, startups, R&D | 72 |
| Mumbai | Tier 1 | ₹45,000 to 90,000 | Finance, media, consulting | 78 (highest) |
| Delhi NCR (incl. Gurugram, Noida) | Tier 1 | ₹42,000 to 85,000 | Consulting, govt, e-comm | 70 |
| Hyderabad | Tier 1 | ₹38,000 to 80,000 | Tech, pharma, GCCs | 58 |
| Pune | Tier 1 | ₹35,000 to 75,000 | IT services, auto, mfg. | 60 |
| Chennai | Tier 1 | ₹32,000 to 68,000 | IT, auto, manufacturing | 58 |
| Ahmedabad | Tier 2 | ₹28,000 to 55,000 | Pharma, textiles, finance | 52 |
| Kolkata | Tier 1 | ₹25,000 to 52,000 | Services, public sector | 55 |
| Kochi | Tier 2 | ₹26,000 to 50,000 | IT, healthcare, shipping | 53 |
| Jaipur / Bhopal / Indore | Tier 2 | ₹22,000 to 45,000 | Services, emerging tech | 48 |
| Smaller cities / rural | Tier 3+ | ₹12,000 to 28,000 | Agriculture, retail, SME | 35 to 42 |
*Numbeo-style index, Mumbai = 78 as benchmark. Lower index = cheaper city. Salaries are spot-rate for salaried employees across sectors; role-level ranges vary widely.
For cost-conscious global employers, Tier-2 cities such as Indore, Jaipur, Coimbatore and Bhubaneswar now host meaningful tech and services talent at roughly 25 to 35% lower all-in cost than Bengaluru, with retention rates that are often higher because the local talent pool has fewer competing offers. If your hiring plan is more than 5 roles, running a city-mix analysis (60% Tier-1, 40% Tier-2) typically lowers your blended cost of employment by 15 to 20% without materially affecting quality.
This is the question most readers actually come for, and it is the section where most blog posts go wrong, because they compare nominal dollars without correcting for purchasing power. We’ll show both views so you can make the right comparison for your use case.
In raw-dollar terms, India’s average salary sits near the bottom of the G20. This is the view that matters for cross-border hiring cost, remittance flows, and global compensation benchmarking.
| Country | Avg. annual salary (USD) | Median (USD) | vs. India (nominal) | Source |
|---|---|---|---|---|
| United States | $63,932 | $43,222 | ~22x higher (mean) | SSA, BLS 2024 |
| Switzerland | $98,600 | $78,900 | ~34x higher | OECD 2024 |
| Germany | $53,100 | $49,200 | ~18x higher | StepStone / OECD |
| United Kingdom | $46,800 | $37,000 | ~16x higher | ONS ASHE 2024 |
| Australia | $62,100 | $55,400 | ~21x higher | ABS |
| Canada | $51,200 | $45,800 | ~18x higher | StatCan |
| Singapore | $67,500 | $55,000 | ~23x higher | MOM |
| UAE | $45,000 (tax-free) | $39,000 | ~16x higher | WorldData.info |
| China (urban) | $18,600 | $15,200 | ~6.4x higher | NBS China |
| India |
$2,878 (per capita) $3,095 (salaried men, PLFS 2025) |
Not published | Baseline | PLFS / IMF |
PPP-adjustment corrects for the fact that ₹100 buys roughly 3.5x more in India than $1 does in the US. This is the view that matters for standard of living, whether an Indian salary provides a middle-class lifestyle even if the nominal number looks small. It is also the view that explains why an Indian-based remote worker earning ₹20 LPA can have roughly comparable disposable income to a US counterpart earning $80,000.
| Country | GDP per capita (PPP, USD) | Ratio vs. India (PPP) | Ratio vs. India (nominal) | Gap reduction from PPP |
|---|---|---|---|---|
| United States | $85,370 | 7.0x | 28.3x | 75% |
| Germany | $69,900 | 5.8x | 23.3x | 75% |
| United Kingdom | $59,050 | 4.9x | 15.3x | 68% |
| Japan | $51,400 | 4.2x | 13.4x | 69% |
| Singapore | $133,700 | 11.0x | 25.4x | 57% |
| UAE | $89,000 | 7.3x | 17.9x | 59% |
| China | $25,000 | 2.1x | 7.4x | 72% |
| India | $12,132 | Baseline | Baseline | n/a |
Sources: IMF World Economic Outlook 2025, World Bank PPP conversion data.
For global employers, the most actionable view is the same-role comparison. Here’s what an experienced senior software engineer costs across major hiring markets in 2026:
| Role: Senior Software Engineer (5 to 8 yrs exp.) | Annual salary (USD) | Multiple vs. India |
|---|---|---|
| United States | $160,000 to $300,000 | 7.0 to 10.5x |
| Switzerland | $140,000 to $200,000 | 6.1 to 7.0x |
| Germany | $90,000 to $130,000 | 3.9 to 4.5x |
| United Kingdom | $85,000 to $145,000 | 3.7 to 5.1x |
| Singapore | $110,000 to $170,000 | 4.8 to 5.9x |
| UAE | $70,000 to $120,000 (tax-free) | 3.0 to 4.2x |
| India | $22,800 to $48,000 (₹19 to 40 LPA) | Baseline |
A US firm hiring a senior software engineer domestically pays ~$240,000 all-in (salary + benefits + payroll taxes + real estate). The same role in Bengaluru or Hyderabad costs ~$38,000 to $55,000 all-in through an Employer of Record, a 5 to 6x cost reduction for a talent tier that performs comparably on technical benchmarks. This is why India remains the single largest destination for Global Capability Centres (GCCs).
If you walk away with only one insight from this section, make it this one: the Indian wage gap is not a talent gap. It is a structural outcome of five interlocking factors, none of which reflect on individual capability.
The single biggest source of the nominal gap is that the cost of producing the same hour of labor, housing, food, transport, services, is dramatically lower in India. When you control for this via PPP, the US-India gap falls from 22x to 7x. The remaining 7x is the real economic gap; the 15x difference is a pricing artifact.
US workers have access to roughly 5 to 7x more capital per worker (machinery, software, infrastructure) than Indian workers. Higher capital intensity means higher output per hour, which translates into higher wages. This gap is closing, Indian digital infrastructure has leapfrogged in the past decade, but it remains the dominant driver of per-capita GDP differences.
Roughly 80% of India’s workforce is in the informal sector (self-employed, casual labor, unorganized enterprises), compared with under 15% in OECD countries. Informal work carries no wage floor, no benefits, and no statutory protections, which pulls the national average down sharply. If you look only at India’s formal salaried workforce (~90 million people), the numbers look very different and closer to emerging-market peers.
The Indian rupee has depreciated against the US dollar by roughly 35% over the last decade. A 7% annual nominal salary increase in India, after currency adjustment, can look flat or negative in USD terms to a foreign observer, even as the Indian worker’s real purchasing power rises.
India adds roughly 10 to 12 million new workers to the labour force every year; the formal economy creates roughly 5 to 6 million formal-sector jobs. That persistent slack keeps wages compressed at the entry and mid levels. The skills-premium dynamic at the top of the market (AI/ML, cloud, product) is the exception, not the rule.
None of these factors reflect individual productivity. An Indian senior engineer working at a US firm, on the same tooling, ships at the same rate as their American counterpart. What you're paying for when you hire in India is not cheaper quality, it is structurally lower cost of living and a market without wage inflation pressure. This is why the arbitrage has been stable for two decades and is not going away.
The consolidation of 29 older labour laws into four Labour Codes (Code on Wages, Industrial Relations Code, Social Security Code, OSH Code) went live in early 2026. The single biggest compensation impact: basic salary must constitute at least 50% of total CTC, versus the previous flexibility to set it at 40% or lower. This changes PF, gratuity and leave-encashment calculations for nearly every salaried employee. If you are offering compensation packages in India, your EOR or PEO partner must recalibrate salary structures before rollout.
The 8th Pay Commission is projected to raise compensation for 1.14 crore central government employees by 13 to 34%, with downstream effects on state government employees (~1.85 crore) and PSUs. Private-sector employers in adjacent skill markets (engineers, clerical staff, mid-level management) should expect retention pressure from government pay hikes in 2026-27.
Specialists in generative AI, cloud security, data engineering, and SRE/platform engineering are commanding 32 to 47% premiums over generalists with the same years of experience. This gap widened by roughly 8 percentage points in 2025 alone. If your talent strategy relies on these skill categories, the “India is cheap” framing is outdated, expect to pay closer to 50 to 65% of US rates for equivalent specialists, not 15 to 20%.
Indian IT attrition peaked at 21.4% in 2022 and is projected to hit 16.5% in 2026. For employers, this is an unambiguously positive shift: the retention premium embedded in 2022-era offers (salary bumps, retention bonuses, aggressive restricted stock) is rationalizing. Total cost of employment is flat-to-down in real terms in 2026.
Global Capability Centres (in-house offshore units of multinationals) have crossed 1,600 in India and are projected to add ~300 more by end-2026. GCCs now employ 1.9 million people and pay 15 to 25% above local market rates. This is pushing up benchmarks for mid- and senior tech talent in Tier-1 cities. If you are not offering GCC-competitive packages for senior talent, expect extended time-to-hire.
At 9% nominal salary growth against 4 to 4.5% projected inflation, 2026 is the first year since 2022 where Indian workers see meaningful real-wage gains of ~4.5%. This is above the historical average and supports consumption-led economic expansion, but it also means foreign employers benchmarking against 2023-24 data will find their offers below market.
If you’re reading this as a founder, Head of People, or talent lead at a company outside India, here is the translation layer from data to action:
Indian compensation is CTC-based, not base-salary-based. A ₹20 LPA offer does not mean ₹20 LPA in-hand. Your real cost includes:
| TCE component | Typical % of gross salary | Notes |
|---|---|---|
| Base salary | 50 to 55% of CTC | Mandatory 50% minimum under new Labour Codes |
| HRA, special allowances | 25 to 30% of CTC | Tax-efficient structuring |
| Provident Fund (employer) | 12% of basic | Statutory; capped at ₹3,000/month where contributions are restricted to the ₹25,000 ceiling |
| Gratuity provision | 4.81% of basic | Paid on exit after 5 years, accrued annually |
| Employee State Insurance | 3.25% (if salary ≤ ₹21,000) | Statutory for lower salary bands |
| Statutory bonus | 8.33 to 20% of basic (capped) | For employees earning ≤ ₹21,000/month |
| Health insurance | ₹8,000 to 25,000/year/employee | Market practice, not statutory |
| Other benefits (meals, transport) | ₹10,000 to 40,000/year | Optional but common |
| Total employer cost | 120 to 135% of advertised CTC | Plan your budget accordingly |
There are three legal routes to employ Indian talent as a non-Indian company. Which one you choose depends on headcount, commitment, and compliance appetite:
| Route | When it fits | Setup time | Monthly cost (typical) |
|---|---|---|---|
| Direct entity (subsidiary) | 20+ employees, 3+ year commitment | 3 to 6 months | ₹2 to 5 lakh fixed overhead |
| Employer of Record (EOR) | 1 to 50 employees, fast market entry | 1 to 2 weeks | $299 to $699 per employee |
| PEO (Professional Employer Org.) | Hybrid co-employment, existing entity | 2 to 4 weeks | 6 to 15% of payroll |
| Independent contractors | Short-term, non-core work | Days | Risk of misclassification |
For most global companies hiring 1 to 50 people in India, the Employer of Record (EOR) route is the dominant choice because it eliminates entity setup, handles payroll and compliance end-to-end, and scales up or down on weeks of notice. If you’re new to the model, start with our deeper explainers: What is an Employer of Record?, Top 10 benefits of partnering with an EOR, and EOR vs. PEO: key differences and which to choose in India. When you are ready to compare providers, our ranking of the best EOR in India sets out fees, coverage and onboarding times side by side.
The three inputs that most influence a competitive offer in India, ranked by importance:
Ignore any of these three and your offer is either over-budget or non-competitive. Most benchmark databases (Michael Page, Aon, Mercer, SHRM) publish role-level medians, but the city and company-type adjustment is on you. Our average salary in India by job role guide breaks out 60+ roles by experience level.
Peorient is an independent advisory. We do not resell any provider, so the recommendation stays focused on what actually fits the business. That includes the right EOR, PEO, or payroll partner based on headcount, countries, compliance needs, and budget. The top providers across India, APAC, and EMEA have already been benchmarked, so the shortlisting work is done.
Planning to hire in India? These deep-dives will save you weeks of research:
This guide uses primary government data wherever possible, cross-referenced against established market-intelligence sources. All figures are 2025 or 2026 wherever available. Last updated: April 2026.
For country by country detail, see our comparisons of average salary in India vs Germany and India vs the UK.
Men in regular salaried jobs in India earned an average of ₹24,217 a month in 2025 (about $258) and women ₹18,353 (about $195), according to the Periodic Labour Force Survey Annual Report 2025 from the Ministry of Statistics. Self-employed men earned ₹17,914 a month, and male casual labourers ₹455 a day. Skilled roles in technology and finance pay several times these averages.
₹50,000/month (₹6 LPA) places you comfortably above the national median and is considered a solid middle-class salary in Tier-2 cities, but modest in Bengaluru or Mumbai. ₹90,000/month (₹10.8 LPA) is upper-middle-class in most cities and affords a comfortable lifestyle including EMIs, savings, and discretionary spending.
In nominal terms, the average US salary ($63,932/year median) is roughly 22x higher than India's average. Adjusted for Purchasing Power Parity (PPP), the gap narrows to about 7x. For the same role, e.g., a senior software engineer, the US pays 7 to 10x more than India in nominal terms, but the PPP-adjusted gap is roughly 3x.
Five structural factors: (1) Purchasing power parity, the same basket of goods costs ~3.5x less in India; (2) lower capital stock per worker; (3) an 80% informal-sector share that drags down national averages; (4) rupee depreciation over the last decade; and (5) persistent labour market slack from 10 to 12 million new workers entering the workforce annually. None of these reflect individual productivity or skill gaps.
India's central government sets a floor-level minimum wage of ₹176 per day (approximately ₹4,576/month), but actual minimum wages vary by state, industry, skill category (unskilled, semi-skilled, skilled, highly skilled) and geographic zone. Some states such as Kerala, Delhi and Haryana enforce significantly higher minimums, up to ₹600+ per day for skilled labour.
Bengaluru (Bangalore) leads India in average tech and startup salaries in 2026, closely followed by Mumbai (which leads in finance and media), Delhi NCR (consulting and government), Hyderabad (tech and GCCs), and Pune (IT services and auto). Bengaluru entry-level and junior roles typically pay 20 to 25% above the national average.
The advertised CTC plus 20 to 35% in employer statutory contributions (PF, gratuity, ESI, bonus), health insurance, and optional benefits. For example, a ₹15 LPA offer costs the employer roughly ₹18 to 20 lakh all-in. If you hire via an Employer of Record in India, add a service fee of $299 to $699 per employee per month on top of that. No entity setup, no compliance overhead, no permanent establishment risk.
Tier-1 cities (Bengaluru, Mumbai, Delhi NCR, Hyderabad, Pune, Chennai) pay 20 to 40% more than Tier-2 cities (Jaipur, Indore, Bhopal, Coimbatore, Kochi) for the same role. However, cost of living in Tier-2 cities is 25 to 35% lower, so disposable income often comes out broadly similar, which is why many employers are now deliberately building Tier-2 talent hubs.
Slowly, yes. In 2025 salaried men earned about 32% more than salaried women on average (₹24,217 against ₹18,353 a month), but women's salaried earnings grew 7.2% against 5.8% for men, according to the Periodic Labour Force Survey Annual Report 2025. The gap is usually narrower in technology and consulting roles than in manufacturing and informal work.
Aon's India Salary Increase Survey projects 9% nominal salary growth in 2026, translating to roughly 4.5% real growth after 4 to 4.5% inflation. Real-estate and infrastructure lead at 10.9%, followed by pharma (9.5%), consulting (9 to 11%), and e-commerce (~9%). Technology consulting is the slowest at 6.8%, below the national average for the first time in a decade.
CTC (Cost to Company) is the total annual cost to the employer, including base salary, allowances, employer PF contribution, gratuity provision, health insurance and statutory bonus. In-hand salary is what the employee actually receives monthly after employee PF (12% of basic), income tax (TDS), and professional tax deductions. A ₹10 LPA CTC typically results in ₹60,000 to ₹70,000 in-hand per month depending on tax regime selected.
Yes, this is precisely what an Employer of Record (EOR) service enables. The EOR becomes the legal employer on paper, handling payroll, taxes, benefits, and compliance, while the foreign company directs day-to-day work. This route eliminates the 3 to 6 month entity setup, removes permanent-establishment tax risk, and typically costs $299 to $699 per employee per month. See our independent shortlist of the best EOR providers in India.
Written by
Lead India Employment and Payroll Specialist · 13+ years experience
Priya is Peorient's resident expert on hiring in India. Former senior HR Tax consultant at a Big 4 firm in Bengaluru and Head of Payroll Operations at a Pune-based EOR. Advocate enrolled with the Bar Council of Maharashtra and Goa. Has run state-level registrations in 14 Indian states.