Average Salary in the US in 2026: $69,770 Mean, $65,052 Median
The average annual wage across all US occupations is $69,770. For full-time wage and salary workers, median weekly earnings were $1,251 in Q2 2026, equal to about $65,052 when annualised. This guide compares US pay by state, occupation, industry, age, sex and education using the latest BLS and Census data.
$
Quick Answer
Average US Salary in 2026
01
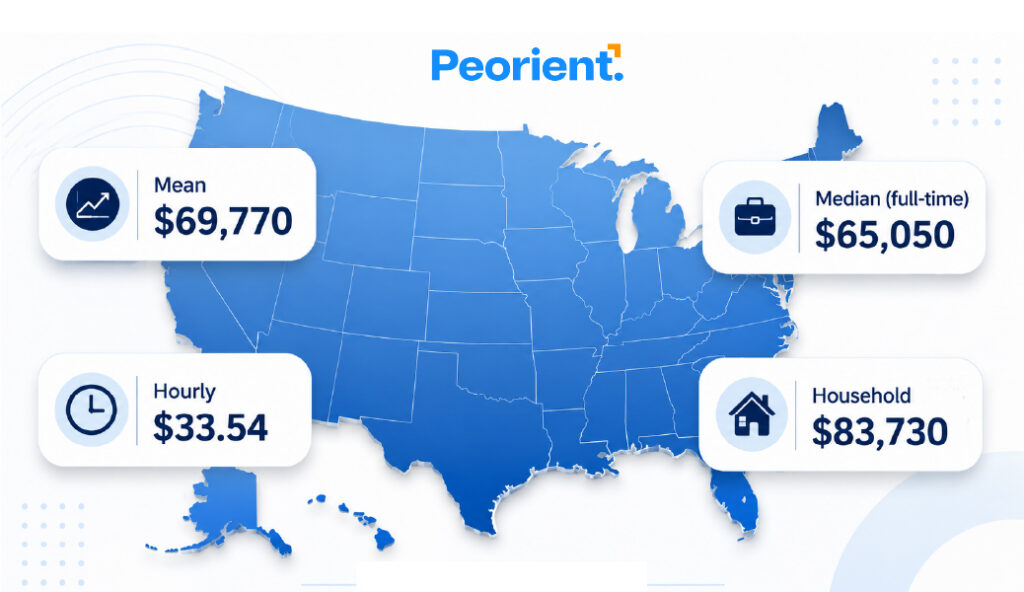
The average mean salary in the US is
$69,770 a year
(about $33.54 an hour), per the BLS May 2025 wage estimates.
02
The median full-time salary is roughly
$65,050 a year
($1,251 a week in Q2 2026), so half of full-time workers earn more and half earn less.
03
Median household income was
$83,730 in 2024
according to the U.S. Census Bureau. This counts every earner in a household, not one individual.
04
Pay ranges from about
$49,740 in Mississippi
to
$83,050 in Massachusetts,
and peaks by age at
35 to 44 ($74,672).
05
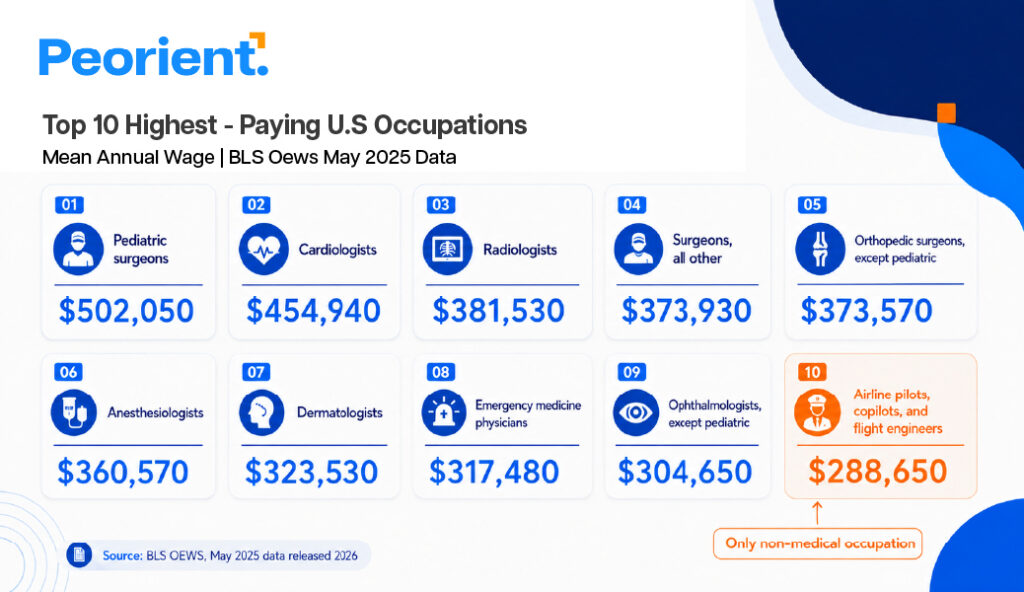
The highest-paying job is
pediatric surgeon at $502,050.
The top non-medical roles include airline pilots and chief executives.
06
For employers,
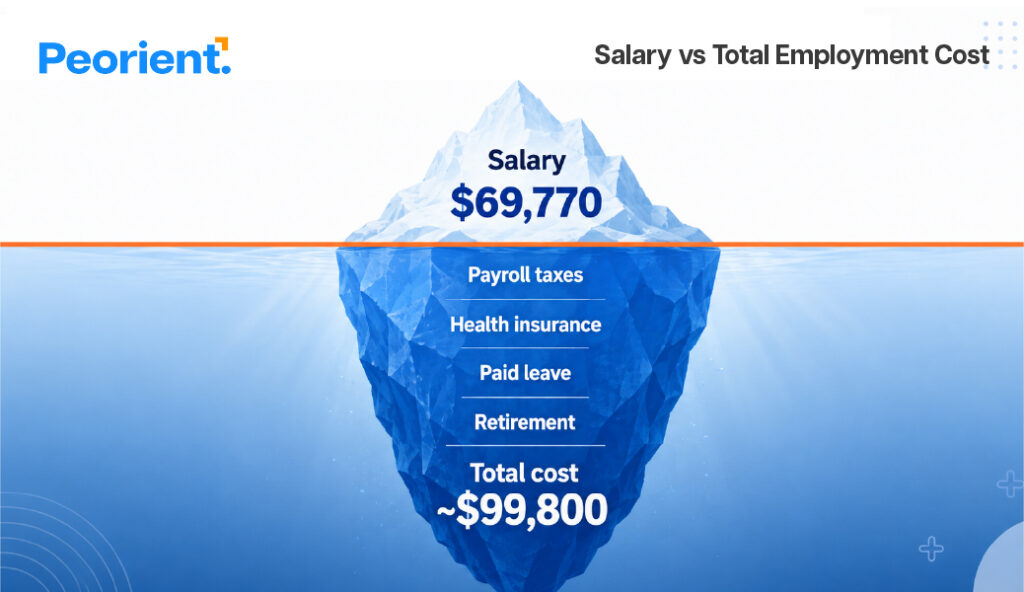
salary represents only about 70% of total compensation cost.
Benefits and payroll taxes can add roughly 30% more.
Employer cost example:
A $69,770 salary translates to an estimated total compensation cost of around
$99,800.
The average wage in the US is $69,770 per year across all occupations, according to the latest Bureau of Labor Statistics Occupational Employment and Wage Statistics data. But “average salary” can mean several different things. The OEWS median hourly wage is $24.51, equivalent to about $50,981 a year at 2,080 hours. Among full-time wage and salary workers specifically, median earnings were $1,251 a week in Q2 2026, or about $65,052 when annualised.
Which figure is right for you depends on the question. Individuals comparing a job offer should look at the median for their occupation, state, and age. Employers budgeting a US hire need the fully loaded cost, which is far higher than salary alone. This guide breaks the average US salary down every way that matters, by state, industry, occupation, age, and gender, using only primary government data, and then shows what a US employee actually costs a company. If you are hiring into the US from abroad, jump to hiring an employee in the US to see why the salary is only the starting point.
What is EOR Payroll? (And How It Differs from Traditional Methods)
EOR payroll is a payroll model where an Employer of Record legally employs and pays workers on behalf of another company. The EOR signs the local employment contract, adds the employee to its payroll, calculates gross-to-net salary, withholds income tax, manages statutory contributions, pays benefits, issues payslips, and files payroll-related compliance documents.
The client company does not need to open a local entity. It still manages the employee’s day-to-day work, role, reporting structure, performance, salary approvals, bonus decisions, and team integration.
In simple terms: the EOR owns the legal employment and payroll layer. You own the work relationship.
What Is the Average Salary in the US in 2026?
The average US salary in 2026 is $69,770 a year (mean, all occupations), while the median full-time worker earns about $65,050. Those two numbers describe the same workforce but answer different questions. The mean is the total wage bill divided by the number of workers, so it is pulled upward by a small group of very high earners. The median is the true middle. For most people, the median is the more honest benchmark.
Average vs median salary: which number should you actually use?
Use the median if you want to know what a typical person earns, and the mean if you want the overall market size. The gap is large: the BLS mean wage of $69,770 sits well above the all-worker median of roughly $51,000 because CEOs, surgeons, and specialist engineers stretch the top of the distribution. Full-time workers show a higher median ($65,050) than all workers because the all-worker median includes part-time and seasonal jobs. Most salary headlines quietly mix these up, which is why the same country can be reported as a $52,000 or a $84,000 nation in the same week.
What is the average US salary per month and per week?
The average US salary is about $5,814 a month before tax; the median full-time worker takes home a gross of roughly $5,421 a month. On a weekly basis, full-time median earnings were $1,251 in Q2 2026, up 4.6% over the year, comfortably ahead of the 3.9% rise in consumer prices over the same period.
What is the average hourly wage in the US?
The average hourly wage is $33.54 (mean, all occupations) or $37.62 for private-sector employees as of July 2026. The two differ because the monthly jobs report (private nonfarm payrolls) and the annual wage survey cover slightly different worker mixes. Average hourly earnings grew 3.2% over the year to July 2026. The all-worker median hourly wage is lower, at $24.51, which annualises to about $51,000.
Key US salary benchmarks, 2026
Benchmark
Amount
Basis
Source (year)
Average (mean) annual wage
$69,770
All occupations
BLS OEWS (May 2025)
Median annual wage, all workers
~$51,000
Midpoint of all jobs
BLS OEWS (May 2025)
Median full-time salary
~$65,050
$1,251/week
BLS CPS (Q2 2026)
Average hourly wage
$33.54
Mean, all occupations
BLS OEWS (May 2025)
Average hourly, private sector
$37.62
All private employees
BLS CES (Jul 2026)
Median household income
$83,730
All earners in a home
US Census (2024)
US Salary Benchmark Calculator
US PAY BENCHMARK
US Salary Benchmark Calculator
Compare your annual salary with national, state and occupation benchmarks.
2025–26 BLS data
$
Used as context only. The occupation benchmark is cross-industry.
$
Your benchmark will appear here
Enter your salary, state and occupation to see the comparison.
Your annual salary$0
US mean$69,770 — Full-time median$65,052 — State average$0 — Occupation average$0 — Approx. national earnings position—
LowerHigher
Estimated employer compensation cost$0
Estimate only. Calculated as salary ÷ 0.699. Actual employer cost varies by benefits, payroll taxes and other compensation.
Benchmark basis: BLS OEWS May 2025 for mean, state and occupation wages;
BLS CPS Q2 2026 for the full-time median and approximate earnings position;
BLS ECEC March 2026 for the 69.9% private-sector wages-and-salaries share of compensation.
What Is the Average Salary in the US by State?
Massachusetts pays the most, at an average of $83,050, and Mississippi the least, at $49,740, a gap of about 67%. State pay tracks the local industry mix far more than anything else. States with dense clusters of technology, biotech, finance, and life sciences, such as Massachusetts, Washington, New York, and California, pull well above the national line. States built on agriculture, food processing, and retail sit below it. The figures below are BLS-derived state averages compiled by Forbes Advisor (July 2026).
Rank
Highest-paying states
Avg salary
Lowest-paying states
Avg salary
Rank 1
Massachusetts
$83,050
Mississippi
$49,740
Rank 2
Washington
$81,550
Arkansas
$53,070
Rank 3
New York
$80,630
West Virginia
$54,940
Rank 4
California
$79,990
Oklahoma
$54,960
Rank 5
Maryland
$76,130
South Dakota (near bottom)
~$55,000
Which region of the US pays the most?
The Northeast leads at an average of $71,481, followed by the West ($67,345), the Midwest ($61,439), and the South ($60,270). Within each region, the pay leaders are Massachusetts (Northeast, $83,050), California (West, $79,990), Maryland (South, $76,130), and Illinois (Midwest, $69,020).
Do high-salary states leave you better off?
Not always, once cost of living is factored in. Massachusetts has the highest headline salary but one of the highest costs of living, so a large slice of the extra pay disappears into housing. Mississippi has the lowest salary but a cost of living roughly 13% below the national average, which narrows the real gap sharply. On a purchasing-power basis, states such as Texas, Tennessee, and parts of the Midwest often deliver more take-home value than their nominal wages suggest. This is a critical point for employers setting remote pay bands: matching the national average in a low-cost state can be generous, while matching it in San Francisco can be uncompetitive. See our employee cost breakdown for how to build location-adjusted bands.
What Is the Average Salary in the US by Occupation?
Management is the highest-paid occupation group at a mean of $145,260, while food preparation and serving roles sit at the bottom near $35,000. Occupation matters more than any other single factor. The BLS groups about 830 occupations into major families; the spread between the top and bottom family is more than fourfold.
Occupation group
Mean annual wage
vs national mean
Management
$145,260
2.08×
Legal
$139,510
2.00×
Computer and mathematical
$120,080
1.72×
Healthcare practitioners and technical
$108,700
1.56×
Architecture and engineering
$106,830
1.53×
Business and financial operations
$95,230
1.36×
Sales and related
$54,960
0.79×
Production
$51,600
0.74×
Office and administrative support
$51,560
0.74×
Food preparation and serving related
$37,150
0.53×
Occupation is one of the strongest determinants of pay. Management occupations average more than twice the all-occupation mean, while food preparation and serving occupations average a little over half of it. These are broad occupational groups, so individual jobs within each group can vary sharply.
What Is the Average Salary in the US by Industry?
Industry
Avg hourly earnings
Avg weekly earnings
Annualised equivalent
Utilities
$56.34
$2,400.08
~$124,804
Information
$55.70
$2,066.47
~$107,456
Financial activities
$49.44
$1,849.06
~$96,151
Professional & business services
$45.68
$1,676.46
~$87,176
Construction
$41.46
$1,637.67
~$85,159
Mining & logging
$42.11
$1,941.27
~$100,946
Wholesale trade
$39.88
$1,571.27
~$81,706
Manufacturing
$36.87
$1,489.55
~$77,457
Transportation & warehousing
$32.63
$1,243.20
~$64,646
Private education & health services
$36.18
$1,186.70
~$61,708
Other services
$34.05
$1,096.41
~$57,013
Retail trade
$26.23
$786.90
~$40,919
Leisure & hospitality
$23.63
$600.20
~$31,210
Industry and occupation are not the same thing. “Software developer” is an occupation. “Information” is an industry. A software developer could work in technology, finance, healthcare or another industry, so employers should benchmark both the job and the sector when setting pay.
Which industries pay the most, and which pay the least?
The best-paying private industries are information (software and data), finance and insurance, professional and scientific services, and utilities; the lowest-paying are leisure and hospitality, retail, and food service. Industry and occupation overlap but are not identical: a software developer earns well whether they work at a bank or a game studio, because the role commands the premium. When you benchmark a hire, benchmark the occupation inside the target industry and metro, not the industry alone. Our global payroll cost guide covers how these bands translate once you add employer contributions.
What Are the Highest-Paying Jobs in the USA?
Pediatric surgeons top every list at a mean of $502,050 a year, followed by cardiologists ($454,940) and radiologists ($381,530). Nine of the ten highest-paying occupations are physician or surgeon roles, all of which require medical school, residency, and licensing.
Occupation
Mean annual wage
Path
Pediatric surgeons
$502,050
Medical school + residency + fellowship
Cardiologists
$454,940
Medical school + fellowship
Radiologists
$381,530
Medical school + residency
Airline pilots and flight engineers
$288,650
Flight training + hours + certification
Chief executives
$269,630
Extensive leadership experience
Nurse anesthetists (CRNA)
$248,320
MSN/DNP + certification
Athletes and sports competitors
$206,180
Elite talent (median is far lower)
Lawyers
~$185,840
Law degree + bar admission
What are the highest-paying jobs that do not require medical school?
Outside healthcare, the top earners are airline pilots ($288,650), chief executives ($269,630), computer and information systems managers (~$185,000), financial managers (~$166,000), and software developers ($137,650). Outside medicine, some of the highest-paying occupations include airline pilots and flight engineers at $288,650, chief executives at $269,630, computer and information systems managers at $192,160, financial managers at $186,910 and software developers at $148,100. Information security analysts average $132,510 and data scientists $126,800.
What Is the Average Salary in the US by Age and Experience?
US earnings peak between ages 35 and 44 at about $74,672 a year, then plateau and slowly decline. This is a notable shift: for years the peak sat in the 45-to-54 bracket, but in the latest Q2 2026 data the 35-to-44 group edged ahead. Younger and older workers earn less, the young because they are early in their careers or working part-time, the old because many cut back hours as they approach retirement.
Age group
Median weekly
Approx. annual
Stage
20 to 24
$831
$43,212
Early career, entry roles
25 to 34
$1,160
$60,320
Building experience, job-switching
35 to 44
$1,436
$74,672
Peak earning years
45 to 54
$1,421
$73,892
Plateau, seniority and leadership
55 and over
$1,335
$69,420
Gradual wind-down, reduced hours
Why do salaries stop rising after your mid-40s?
Growth flattens because raises shift from skill-building to inflation-tracking, and because senior roles are limited. In your 20s and 30s, pay climbs fast as you gain skills, change jobs, and move into specialised or supervisory work. By the mid-40s most workers have reached the ceiling of their role, and further gains depend on promotion into a scarce number of leadership seats. The dip after 55 is partly a measurement effect: higher earners who can afford to often retire or move to part-time and consulting work, which lowers the group median.
What Is the Average Salary in the US by Education Level?
Earnings rise sharply with educational attainment. Among full-time workers aged 25 and older in Q2 2026, median weekly earnings ranged from $803 for workers without a high-school diploma to $1,963 for workers with an advanced degree.
Education level
Median weekly earnings
Annualised equivalent
Less than high school
$803
$41,756
High school, no college
$994
$51,688
Some college or associate degree
$1,125
$58,500
Bachelor’s degree or higher
$1,768
$91,936
Bachelor’s degree only
$1,628
$84,656
Advanced degree
$1,963
$102,076
Education is strongly associated with earnings, but these figures are not estimates of the financial return from a degree. Occupation, experience, location and industry also affect pay.
What Are Median US Earnings by Sex?
In Q2 2026, women working full time had median weekly earnings of $1,131, compared with $1,380 for men. That puts women’s median earnings at 82.0% of men’s median earnings in the BLS dataset. Annualised, those figures equal about $58,812 for women and $71,760 for men.
Group
Median weekly
Annualised
Men
$1,380
$71,760
Women
$1,131
$58,812
Women-to-men ratio
82.0%
—
This is an aggregate earnings comparison, not a measure of the pay gap between men and women performing the same job. Differences in occupation, hours, experience, industry and other factors are not controlled for in this table.
What Is a Good Salary in the US in 2026?
A “good salary” depends on location, household needs and occupation, but the national earnings distribution gives a useful starting point. Among full-time wage and salary workers in Q2 2026, the median was $1,251 a week and the 75th-percentile threshold was $1,915. Annualised, that puts the median near $65,052 and the 75th percentile near $99,580:
Annualised earnings
Approx. position
Interpretation
$44,200
25th percentile
About 25% earn at or below this level
$65,052
Median
Middle of full-time earnings distribution
$99,580
75th percentile
Around top quarter
$152,048
90th percentile
Around top 10%
Is $100,000 a Good Salary in the US?
Nationally, $100,000 is around the 75th-percentile threshold for full-time wage and salary workers based on Q2 2026 BLS data. In other words, it is roughly a top-quarter full-time salary before adjusting for occupation or location.
Above $65,050 (full-time median): you earn more than half of full-time American workers.
Above $83,730 (median household income): your single salary matches what a whole typical household brings in.
Above $100,000: you sit in roughly the top 18 to 20% of individual earners nationally, before adjusting for location.
For a realistic view, always adjust for state cost of living and compare against your own occupation, not the national average. A six-figure offer in a low-cost metro can be worth far more than a higher number in a coastal one.
Hiring an Employee in the US? Salary Isn't the Only Cost
For an employer, salary is only about 70% of what a US employee actually costs; benefits and payroll taxes add roughly 30% on top. This is the number most hiring plans get wrong. According to the BLS Employer Costs for Employee Compensation report (March 2026), private-industry employers spend an average of $46.60 per hour worked on each employee. Of that, wages and salaries are $32.60 (69.9%) and benefits are $14.01 (30.1%). In other words, every dollar of salary carries roughly 43 cents of additional cost.
The real cost of a $69,770 US salary
Base salary:$69,770
Benefits and employer taxes (about 30% of total):
~$30,000
Total cost to employer:about $99,800 per year
The 30% stack includes legally required items (Social Security, Medicare,
federal and state unemployment, workers' compensation) plus health
insurance, paid leave, and retirement contributions.
Component
Share of total compensation
Wages and salaries
69.9%
Total benefits
30.1%
Paid leave
7.6%
Supplemental pay
4.1%
Insurance
7.8%
Retirement and savings
3.4%
Legally required benefits
7.2%
What does it cost to hire in the US through an EOR?
An Employer of Record typically adds $800 to $1,400 per employee per month on top of salary, split between a platform fee and benefits. Per our Employer of Record USA guide, EOR pricing has two layers: a platform fee of about $499 to $699 per employee per month, and a benefits cost of about $300 to $700+ per employee per month. That premium buys compliant hiring across all 50 states without you registering a legal entity, which matters because payroll tax, wage-and-hour, and paid-leave rules differ in every state, and California, New York, and Massachusetts are especially complex.
How can you hire a US employee without setting up an entity?
Use an Employer of Record (EOR) or a Professional Employer Organization (PEO): the EOR becomes the legal employer so you can onboard in days, while you keep full control of the work. An EOR is the right tool when you have no US entity and want to hire quickly; a PEO fits when you already have an entity and want to outsource HR, payroll, and benefits administration. Peorient is an independent advisory: we do not sell EOR services ourselves, so we compare providers on your behalf. If you are weighing options, our team can match you with the right EOR or PEO based on headcount, states, and timeline.
Frequently Asked Questions
What is the average salary in the US in 2026?
The average (mean) US salary is $69,770 a year, or about $33.54 an hour, per BLS May 2025 wage estimates. The median full-time salary is lower, around $65,050 a year ($1,251 a week in Q2 2026), because a small number of very high earners lift the mean.
What is the median salary in the US?
The median wage for all US workers is about $51,000 a year, and about $65,050 for full-time workers. The median is the midpoint: half of workers earn more and half earn less. It is a more realistic benchmark for a typical worker than the mean.
What is a good salary in the US in 2026?
A good salary generally starts above the full-time median of about $65,050, with $100,000 placing you in roughly the top 18 to 20% of individual earners. What counts as good depends heavily on the state and city, because cost of living varies widely.
Which US state has the highest average salary?
Massachusetts has the highest average salary at about $83,050, followed by Washington ($81,550) and New York ($80,630). Mississippi is lowest at about $49,740. After adjusting for cost of living, the ranking shifts, and lower-cost states can offer better purchasing power.
What are the highest-paying jobs in the USA?
Pediatric surgeons ($502,050) and cardiologists ($454,940) are the highest-paying jobs overall. Outside medicine, airline pilots ($288,650), chief executives ($269,630), and technology managers and software developers lead.
At what age do US salaries peak?
US salaries peak between ages 35 and 44, at about $74,672 a year in the latest 2026 data, then plateau through the mid-50s and decline as workers reduce hours before retirement.
How much does it really cost to employ someone in the US?
Salary is only about 70% of the total cost. Benefits and payroll taxes add roughly 30%, so a $69,770 salary costs an employer close to $99,800 a year. Hiring through an EOR typically adds $800 to $1,400 per employee per month on top of salary.
Can I hire a US employee without opening a US entity?
Yes. An Employer of Record (EOR) becomes the legal employer in the US and handles payroll, tax, and compliance across all 50 states, letting you onboard in days while you manage the work. It is the fastest compliant route when you have no local entity.
Sources and Further Reading
All figures are drawn from primary US government data, cross-checked against the releases below.
Head of Cross-Border Tax and Compliance · 14+ years experience
Claire leads cross-border tax and compliance at Peorient. Previously at PwC Global Mobility Tax and Mercer, she specialises in permanent establishment risk, employer tax obligations, and co-employment tax implications. CTA, ACCA, CEBS, M.Sc. Taxation (LSE).
PE risk diagnosisCross-border payroll taxWorker classificationBenefits design